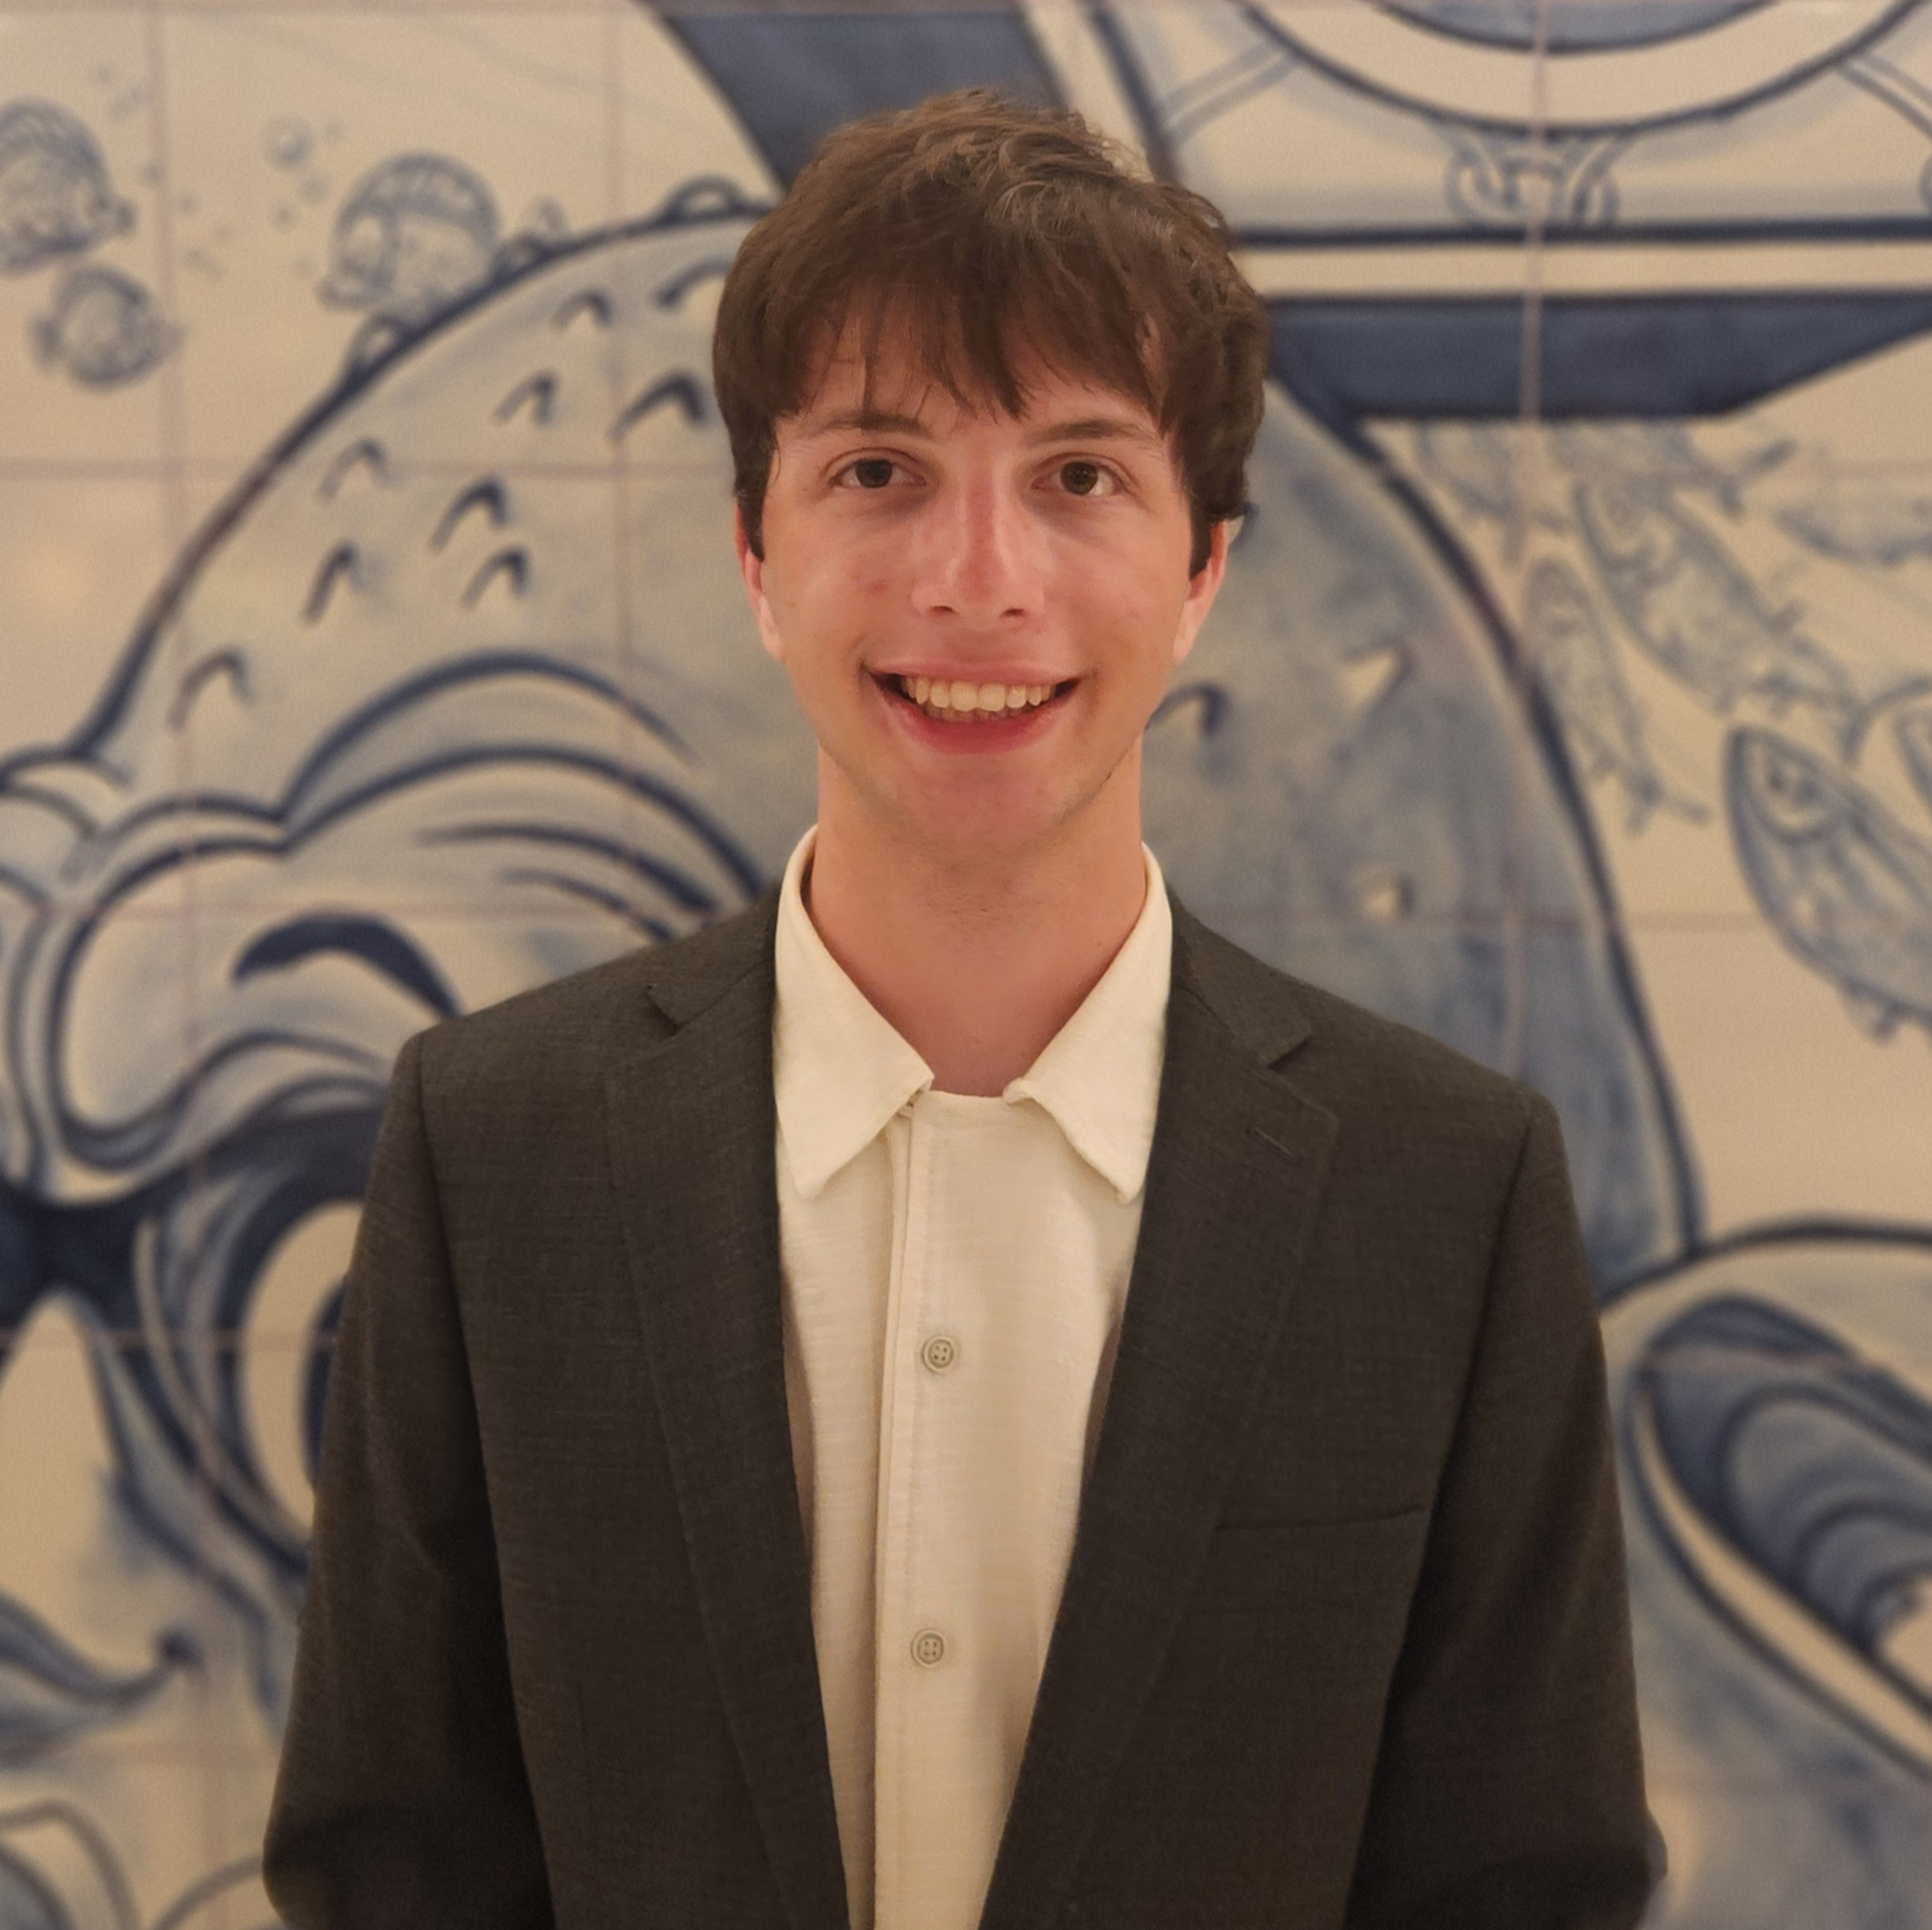
Hi! My name is Nick and I'm a senior math major at UT Austin. I'm also minoring in Statistics & Data Science, and earning a certificate in Computer Programming.
My portfolioA data analytics project analyzing professional Counter-Strike 2 rounds using PostgreSQL, SQL, Python, pandas, scikit-learn, and Tableau.
learn more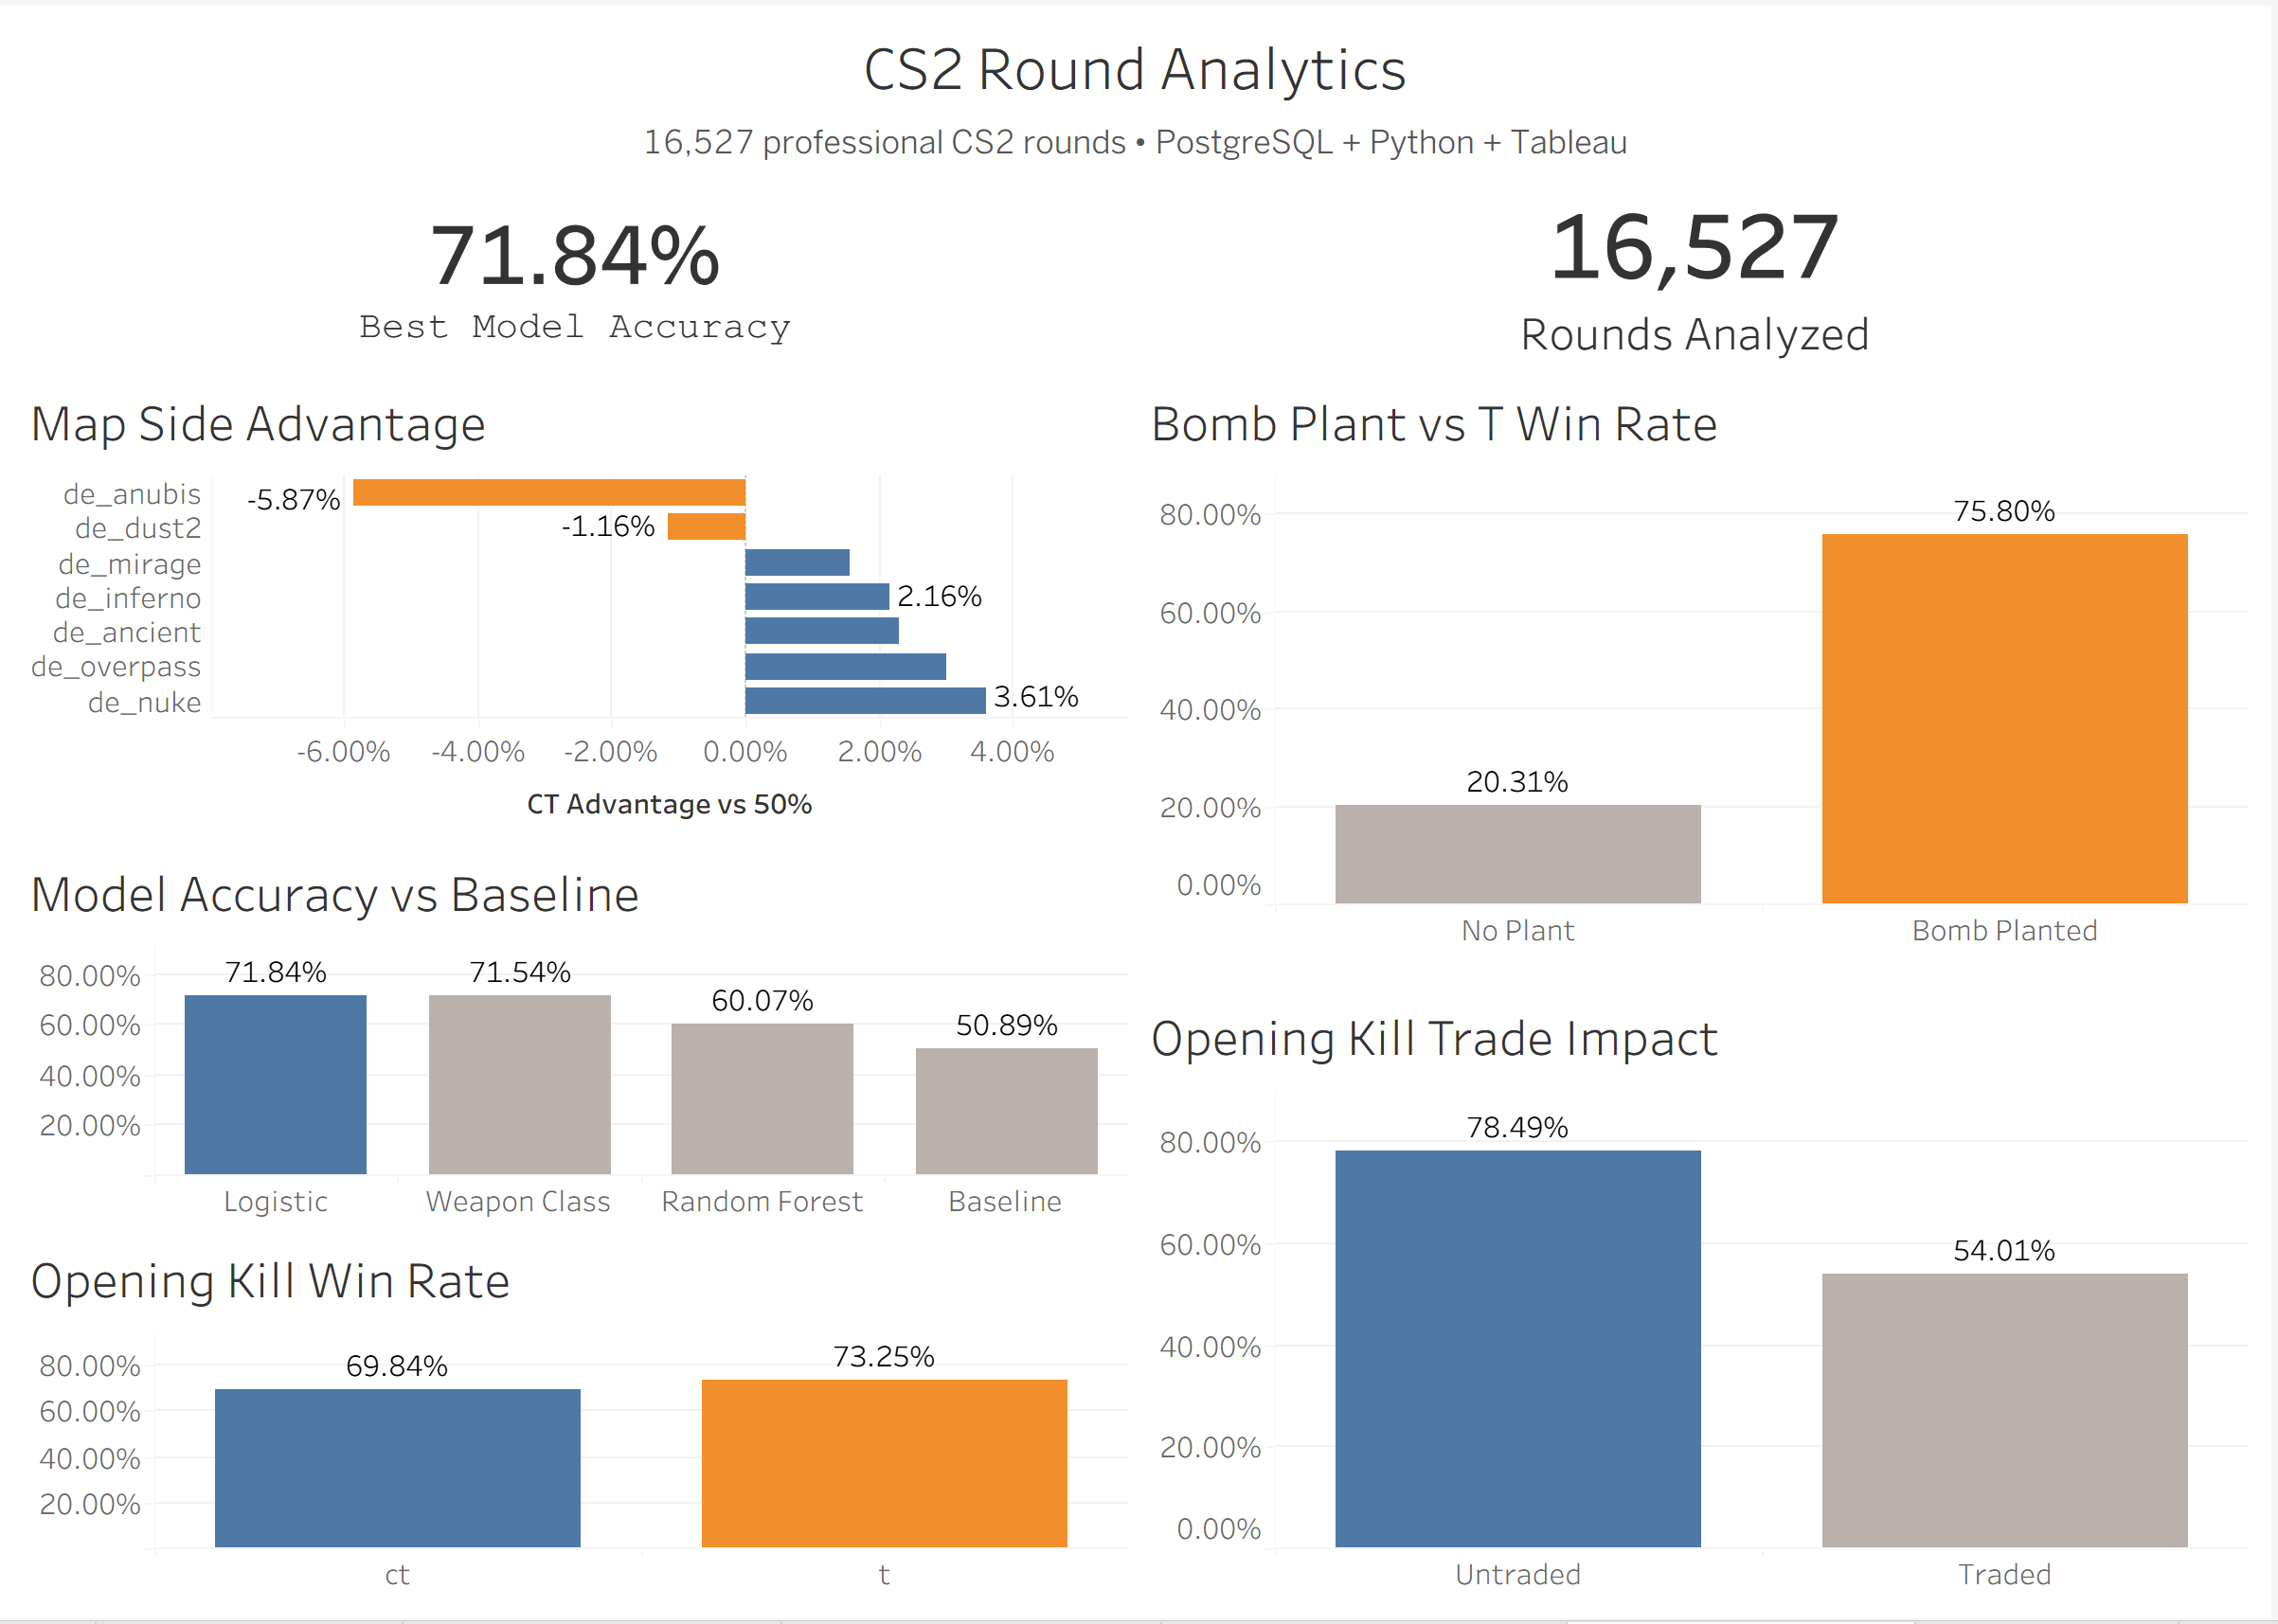
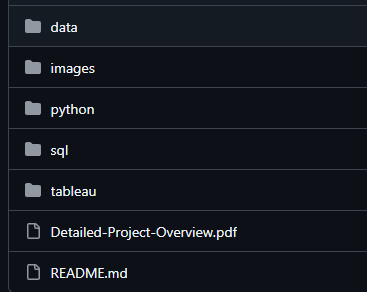
Built a full CS2 analytics pipeline using professional match data, moving from raw Parquet files into PostgreSQL, then into Python for analysis and modeling, and finally into Tableau for visualization.
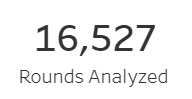
Analyzed 16,527 rounds and 111K+ kills using joins, CTEs, window functions, and aggregate queries.
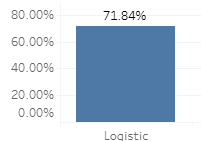
Compared classification models for predicting CT vs. T round winners, with logistic regression reaching 71.8% accuracy.
Created a Tableau dashboard showing map advantage, opening kills, bomb plants, trades, and model performance.
Machine Learning Dashboard of interactive visualizations that use unsupervised clustering, supervised classification, and multiple prediction models to find the most important environmental factors for determining fire size.
learn more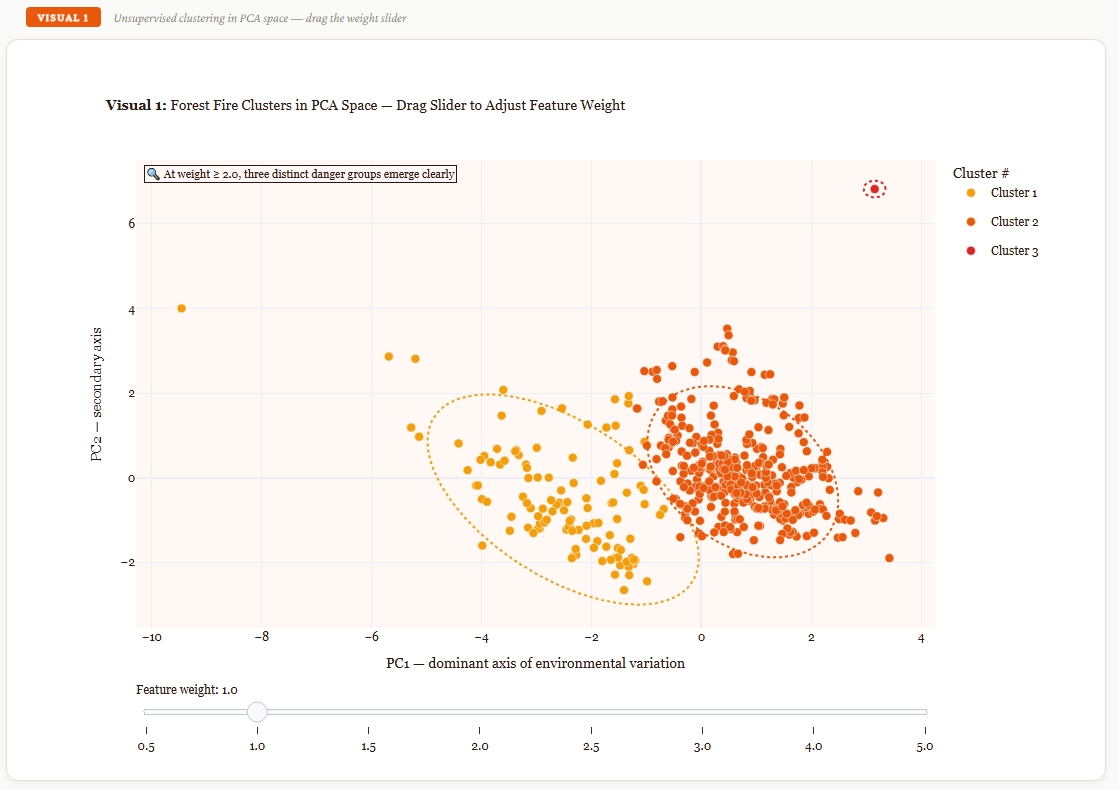
Group visual and machine learning analysis of a wildfire dataset focused on Montesinho Natural Park, Portugal.
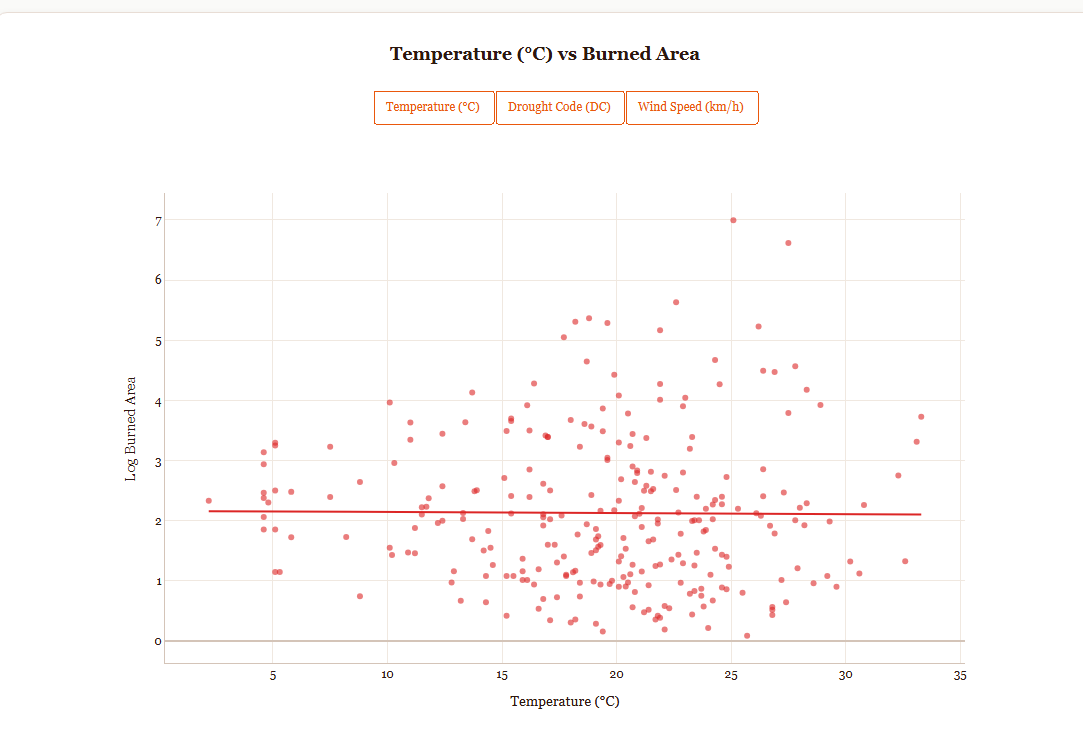
First compares individual features to look for a direct correlation between them and burned area. Determined that there is little correlation.
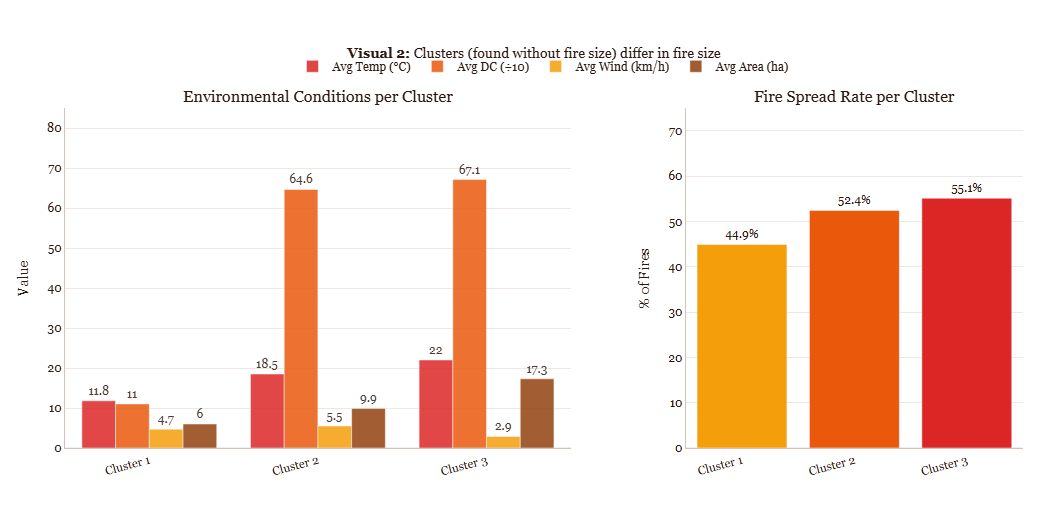
Uses unsupervised clustering to find fire-severity groups from environmental conditions.
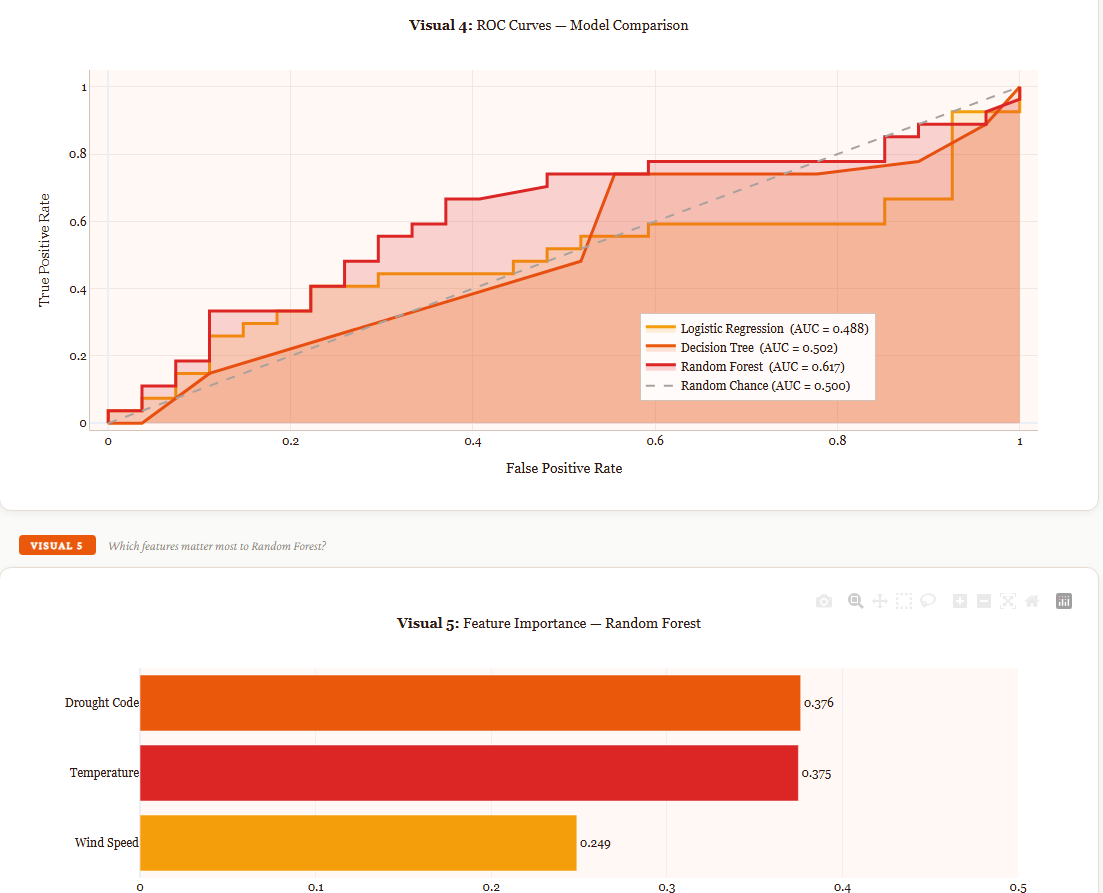
Compares model significance and feature importance. Found that Random Forest had the highest Accuracy, and Drought Code and Temperature were the most important out of the 3 focused features.
Data Visualization Project that uses personally built dataset of mythological characters and their relevant locations from the Odyssey to display connections between them through interactive visualizations.
learn more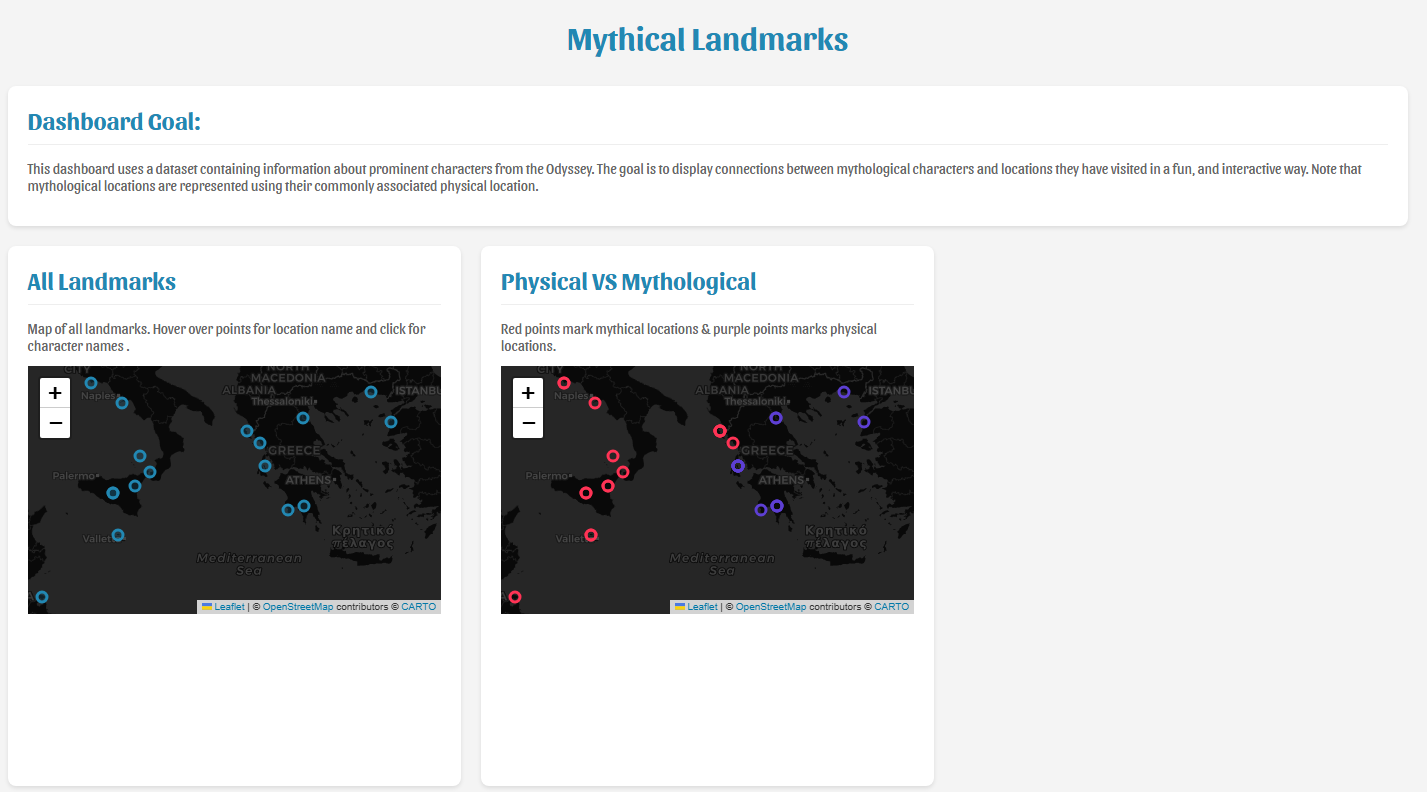
Intro to Mythology Project that focused on displaying connections between the most prominent characters and locations from the Odyssey. Personally wrote the dataset. Used jupyter notebook to make visualizations.
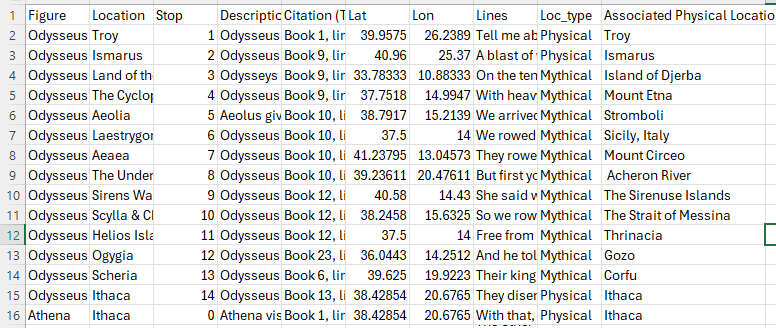
Sourced characters, location data, citations to build dataset.
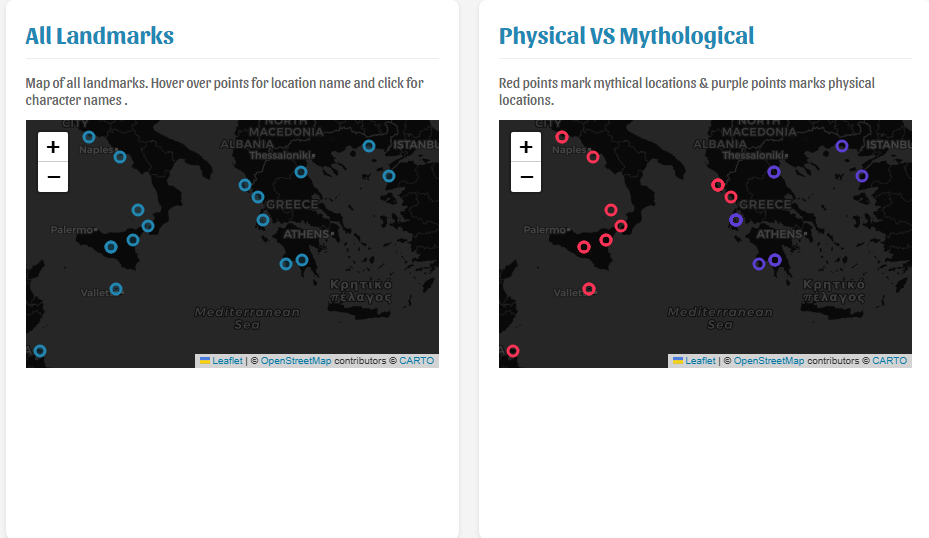
Made maps to compare physical and mythological locations
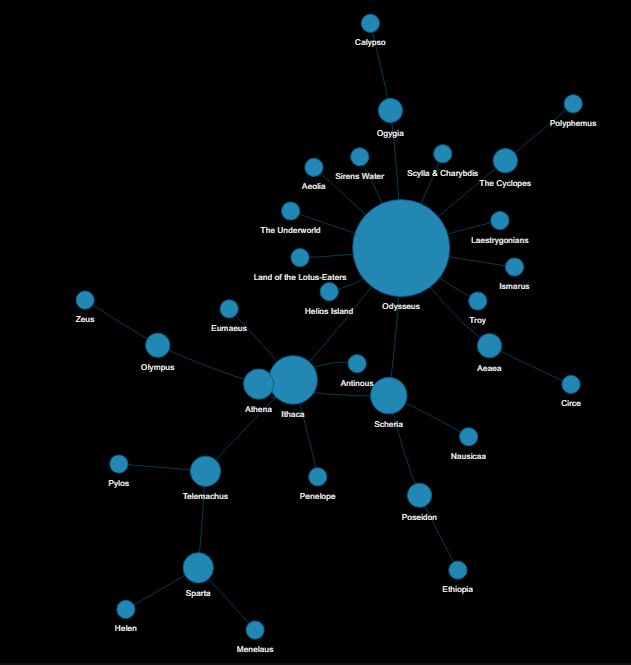
Made interactive node graph for visual comparison of connections among characters/locations
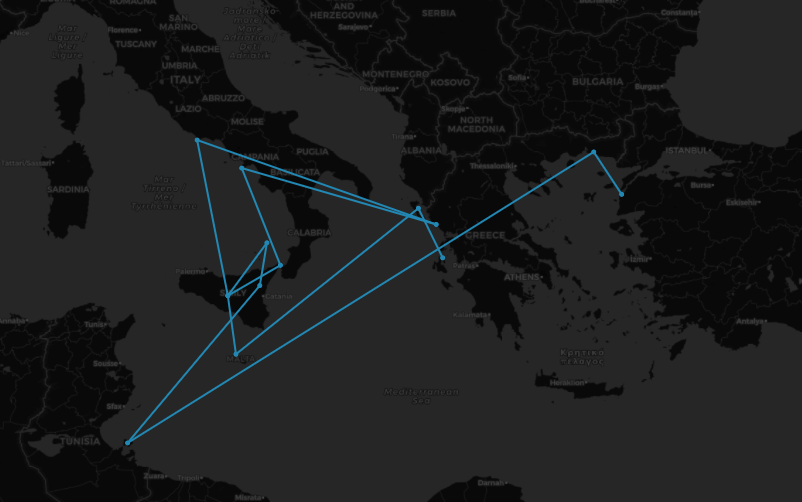
Made interactive maps of Odysseus' journey using 'stops' column from dataset.
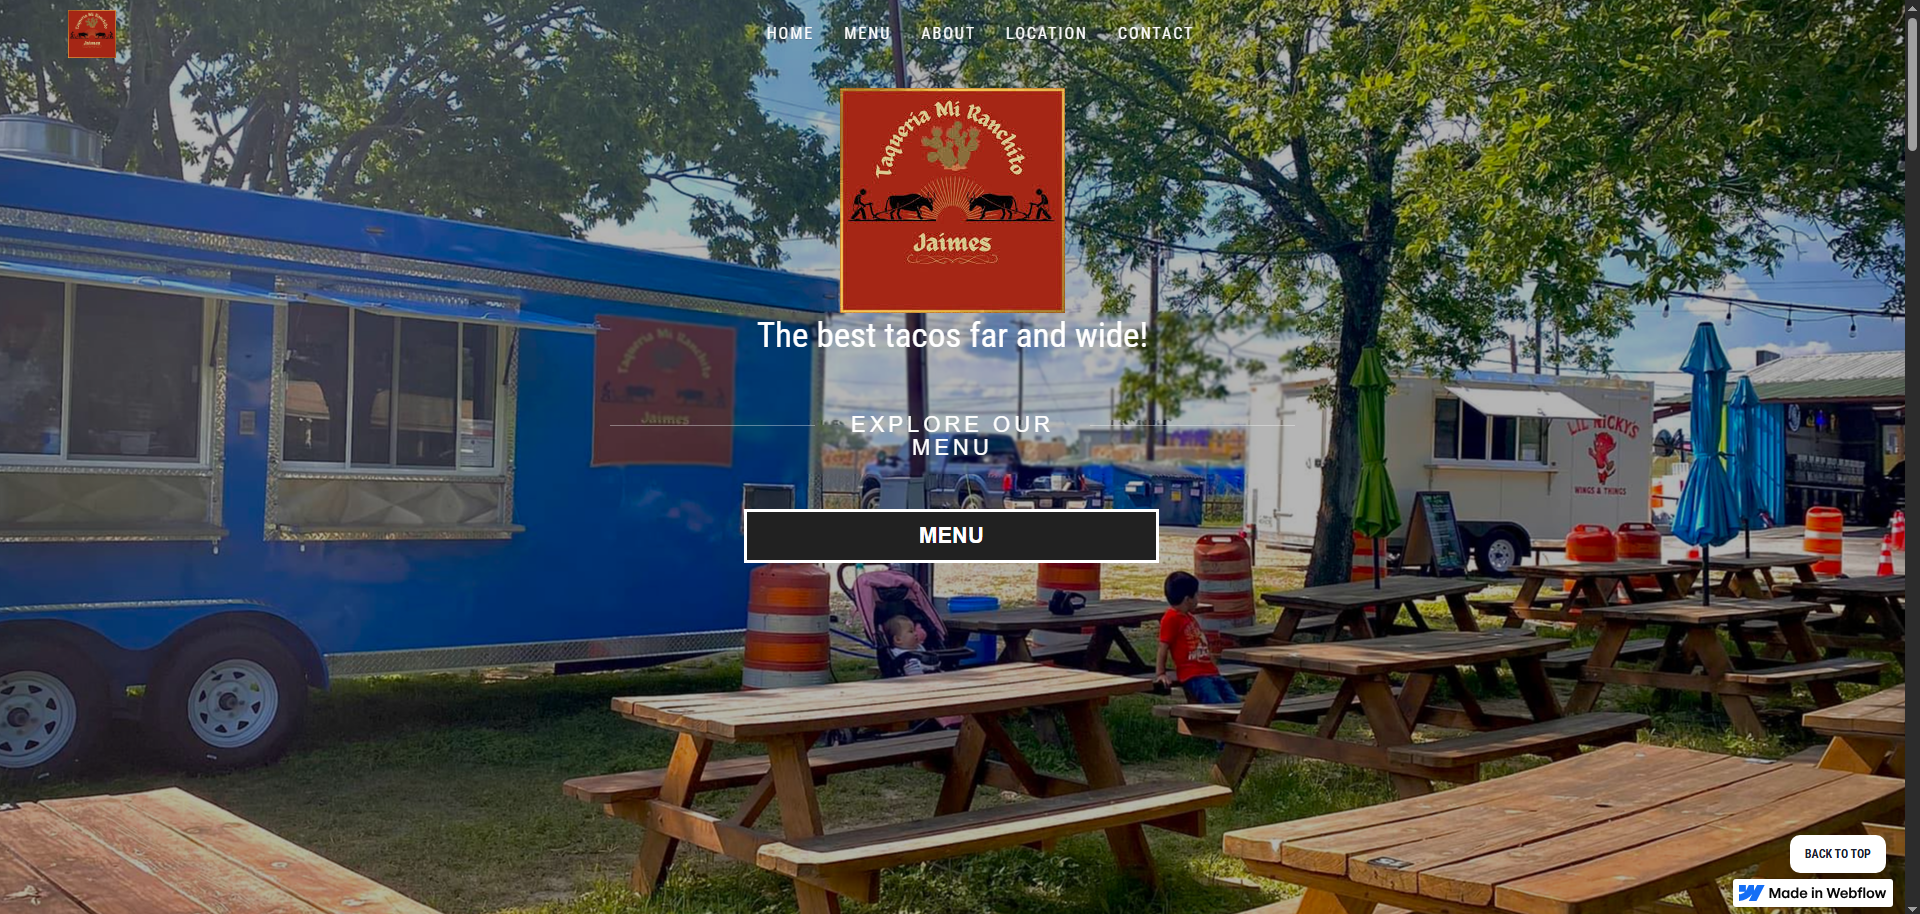
Food truck website that uses embeded menu which will automatically update periodically to include changes to a spreadsheet containing menu items. This makes it easy for food truck owners to keep track of their menu and update it on the website for constant up-to-date information.

Website section that uses webflow, github, google cloud, and google sheets to seamlessly automatically work together in order to automatically update the website menu after the user changes the menu on the google sheet. Allows the user to have just one page to keep track of their menu, and prevents them from having to manually update the website or having someone else do it.
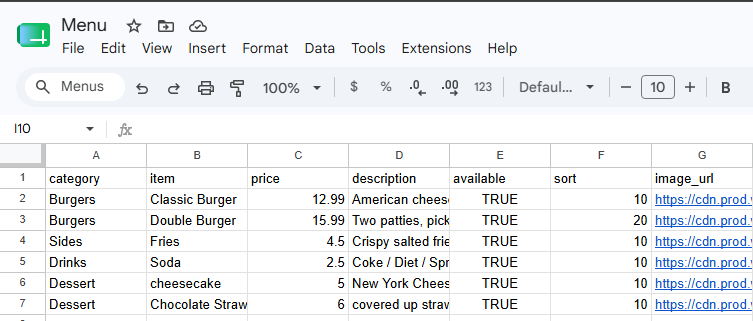
Workflow pulls from a google sheet containing attributes such as category, item, price, image url, etc.
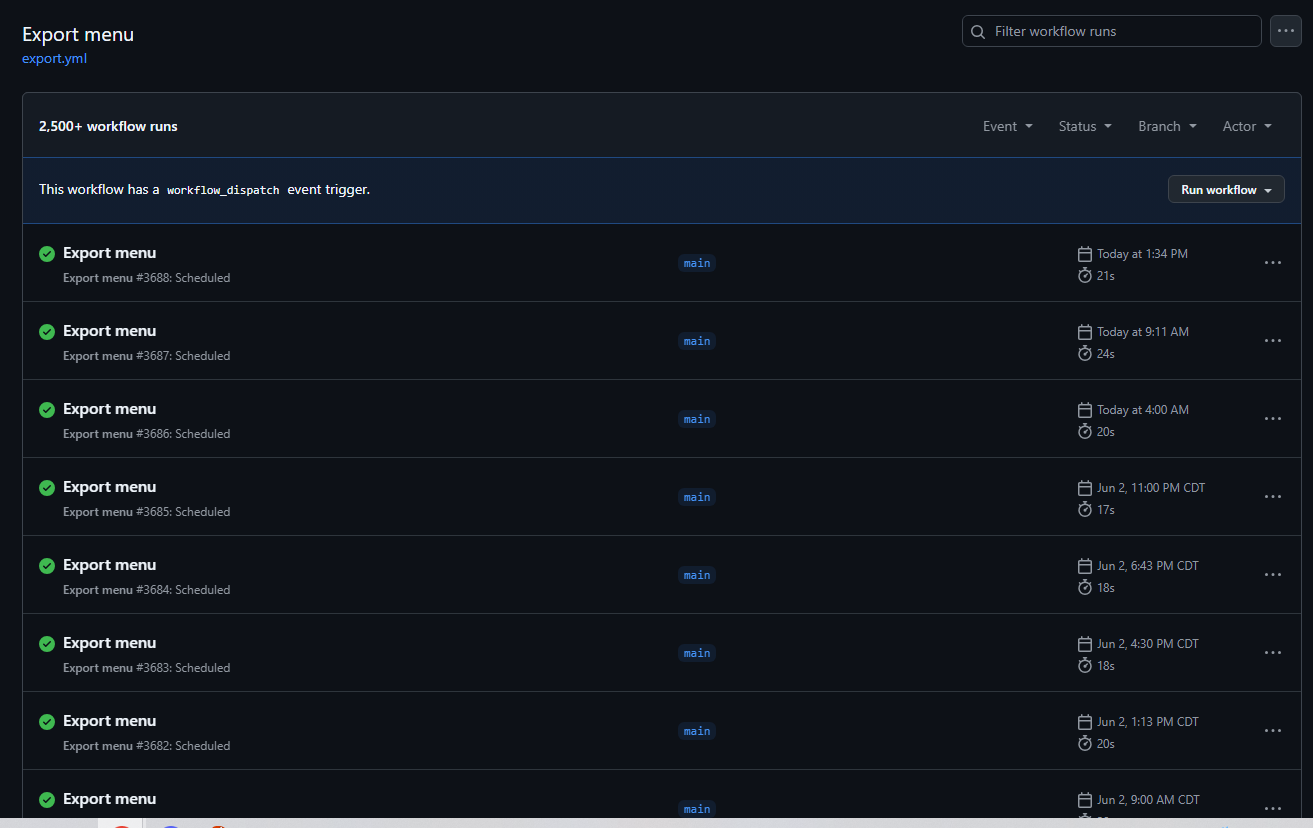
Github reads the sheet using Google Cloud and publishes a JSON file.
Webflow displays the file using a script.
In depth research proposal of electromagnetic monorail for UTSA campus. Includes solidworks model and 3D printed model of monorail car.
Learn more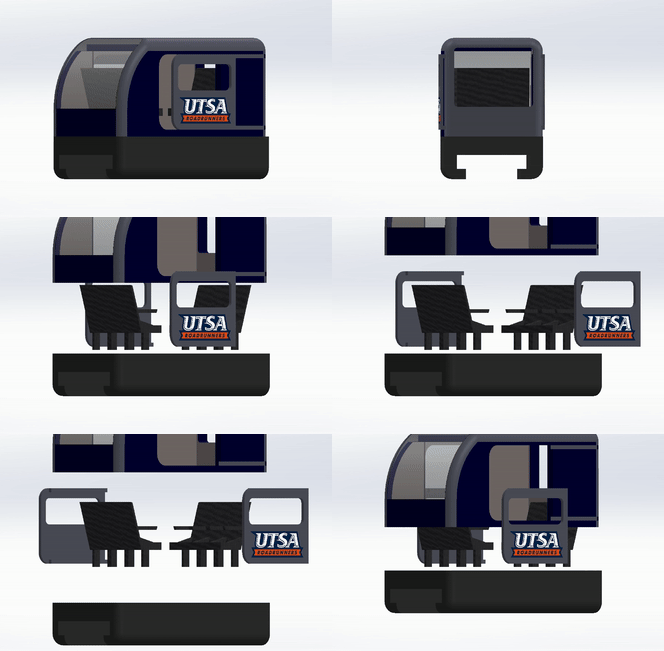
UTSA group proposal of electromagnetic monorail system. Research paper and presentation that included working with a group to plan routes across the campus, design the track and maglev, and estimate the cost of the project.
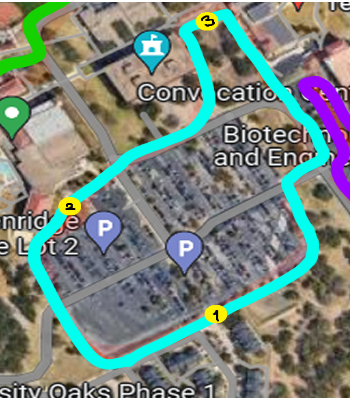
Designed multiple routes the maglev would follow.
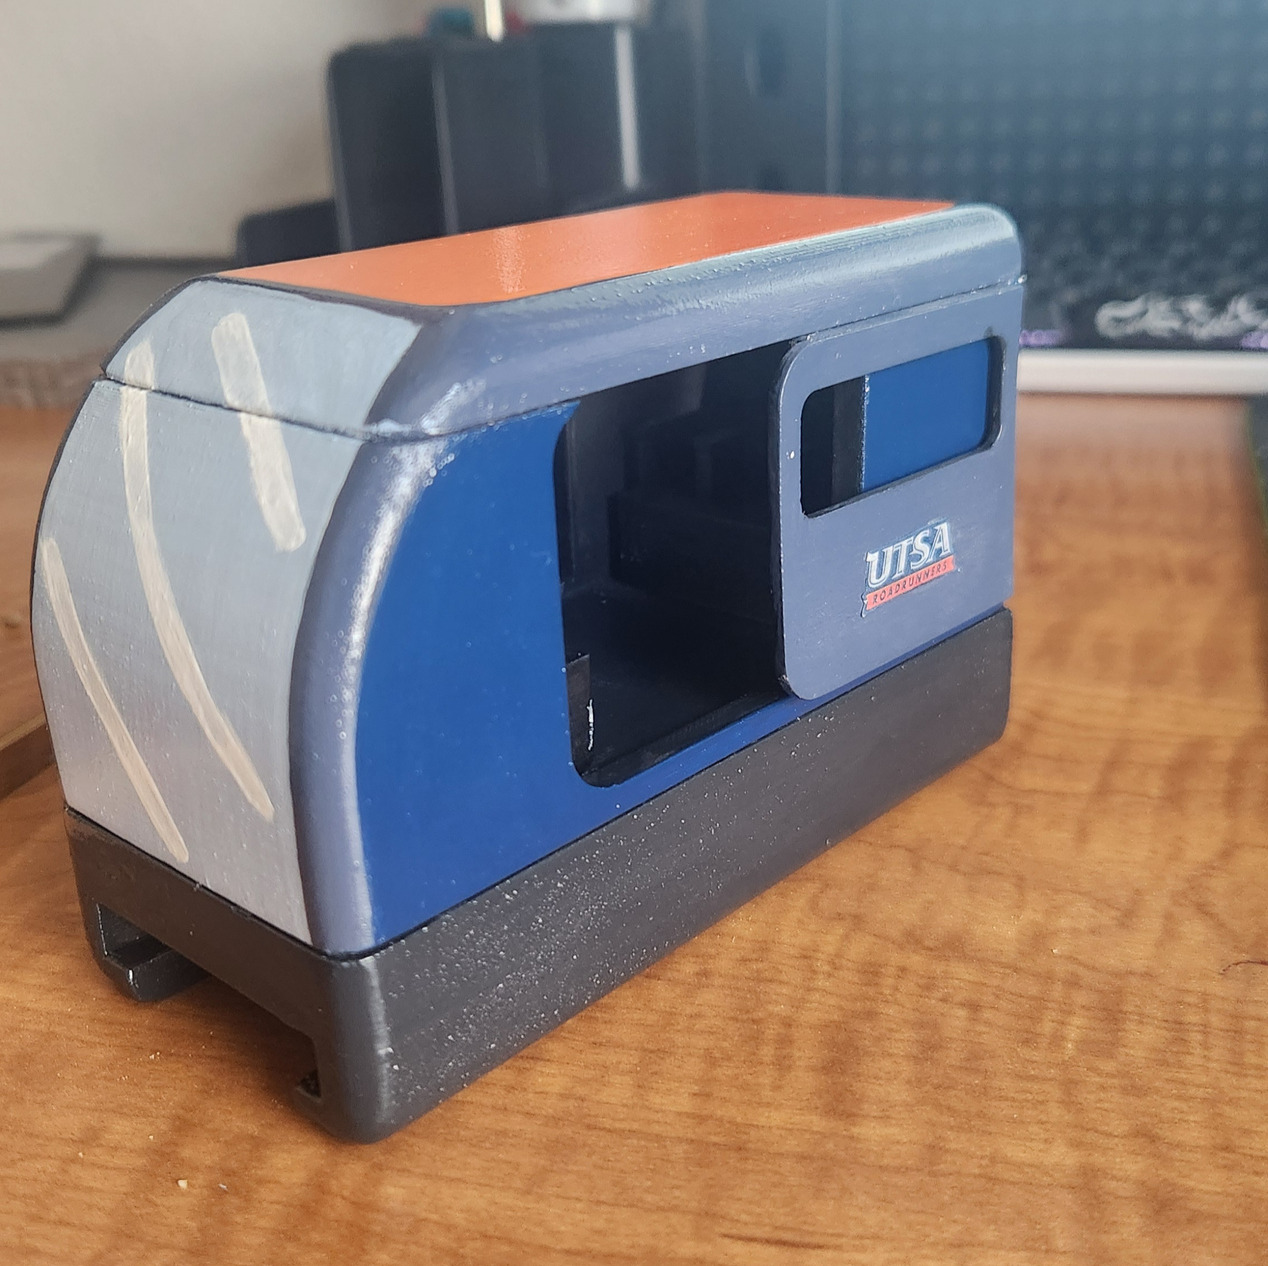
Modeled and 3D printed maglev using Solidworks.

Estimated the cost using cost of track and the monorail.
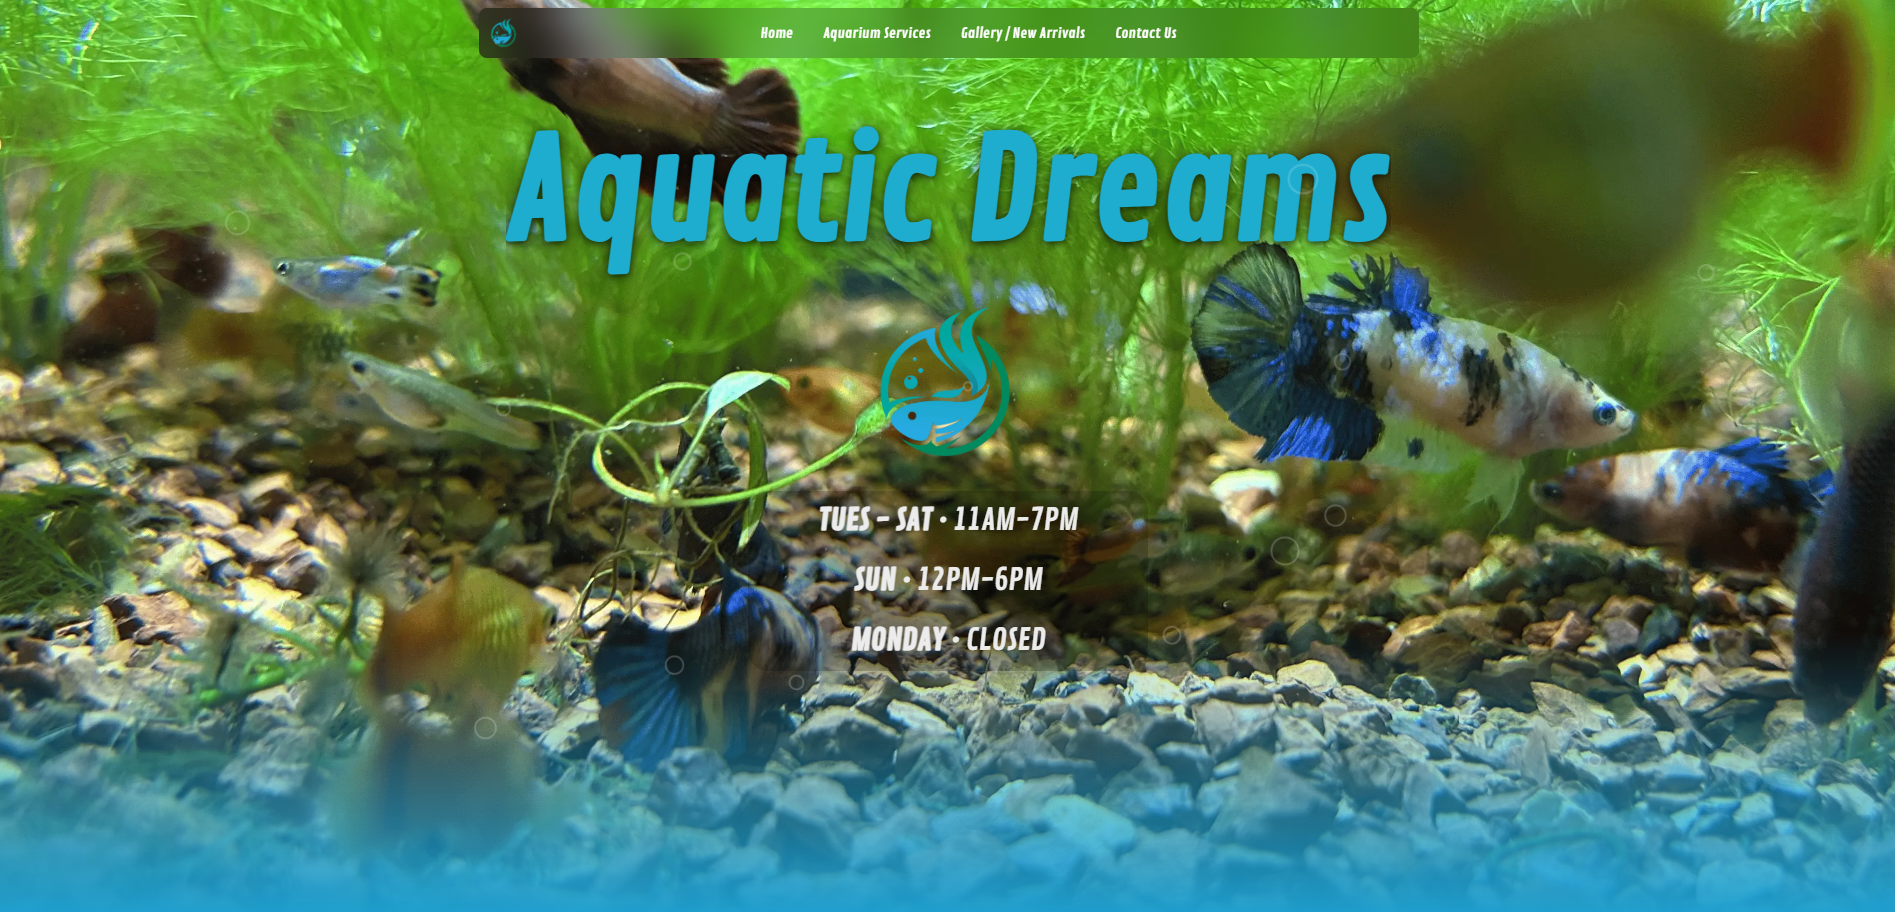
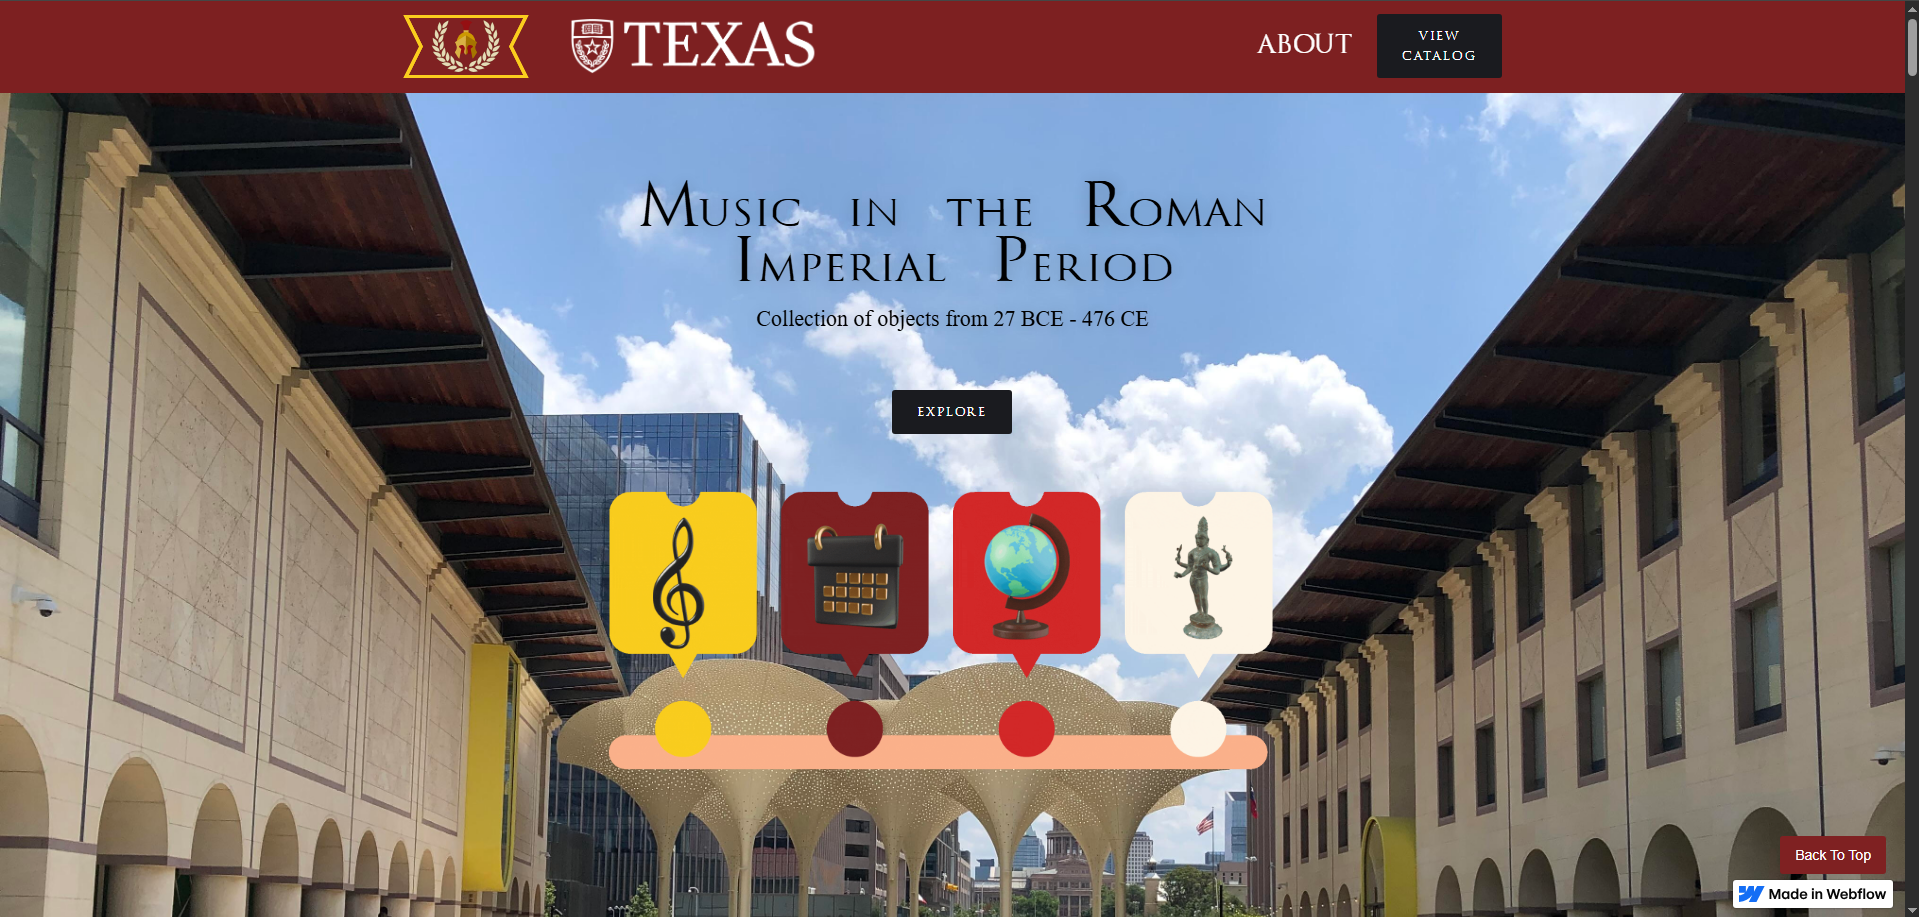
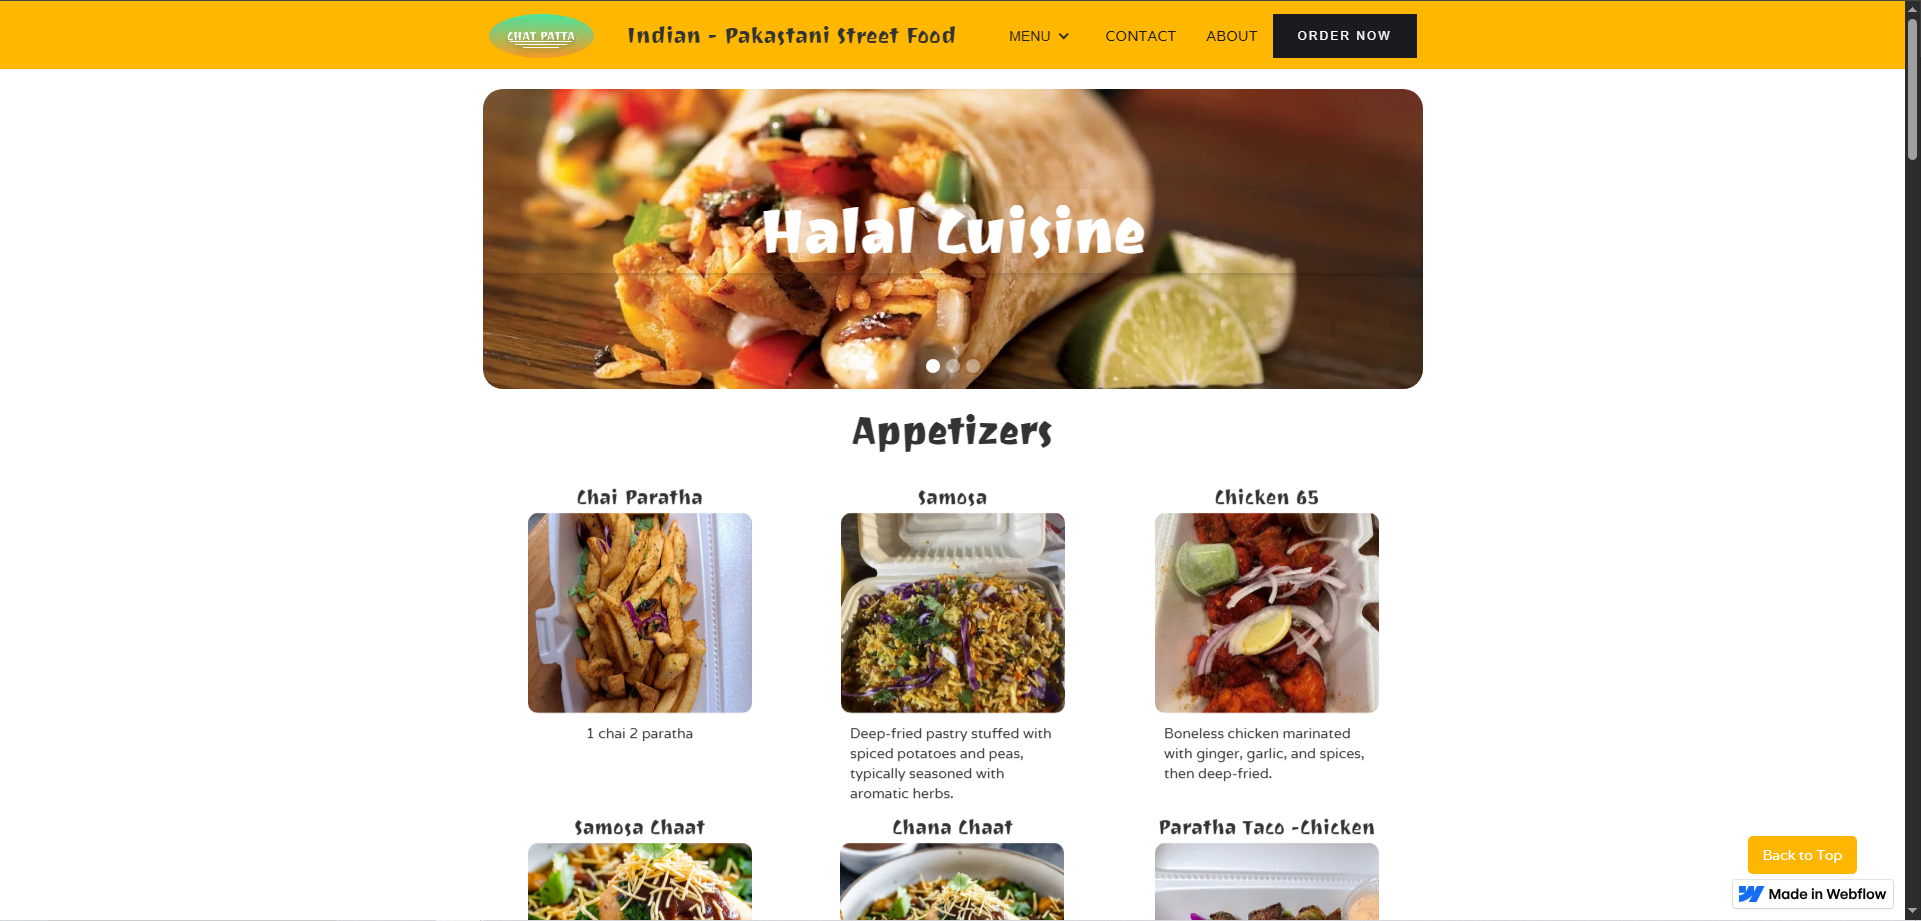
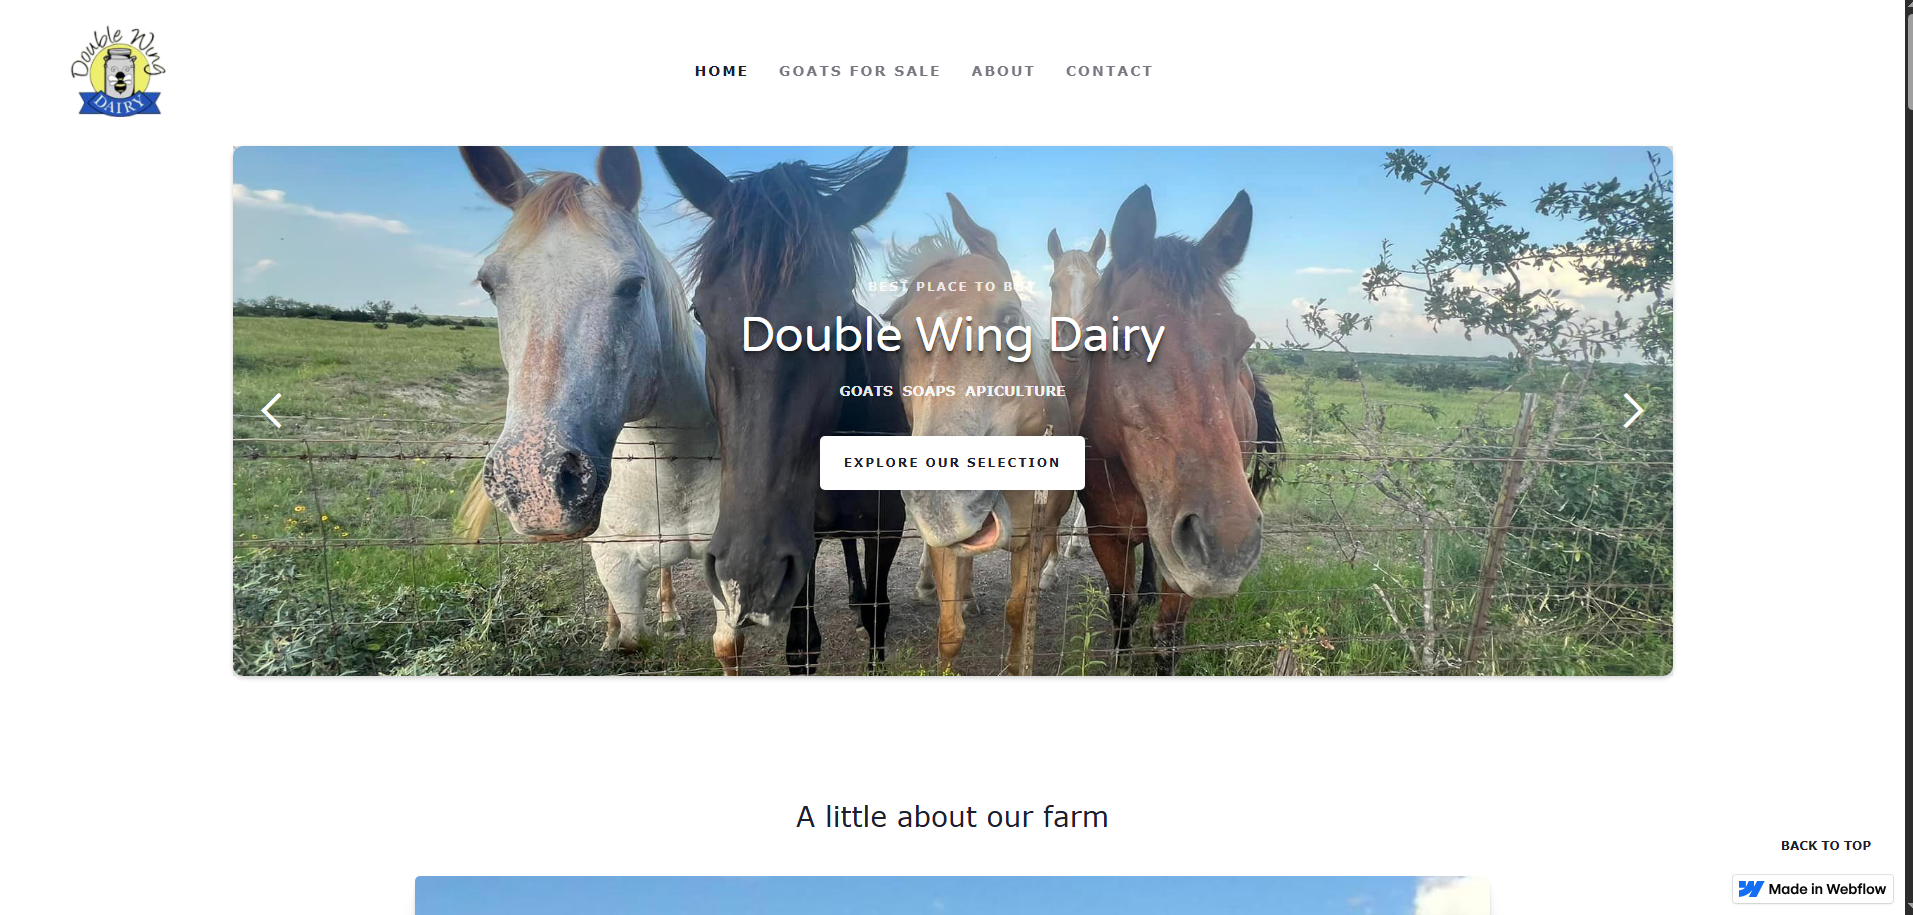
Explore the websites I've designed!
I enjoy building websites occasionally, whether it be for class projects, or businesses.
Dashboard of connections between mythological characters and locations.
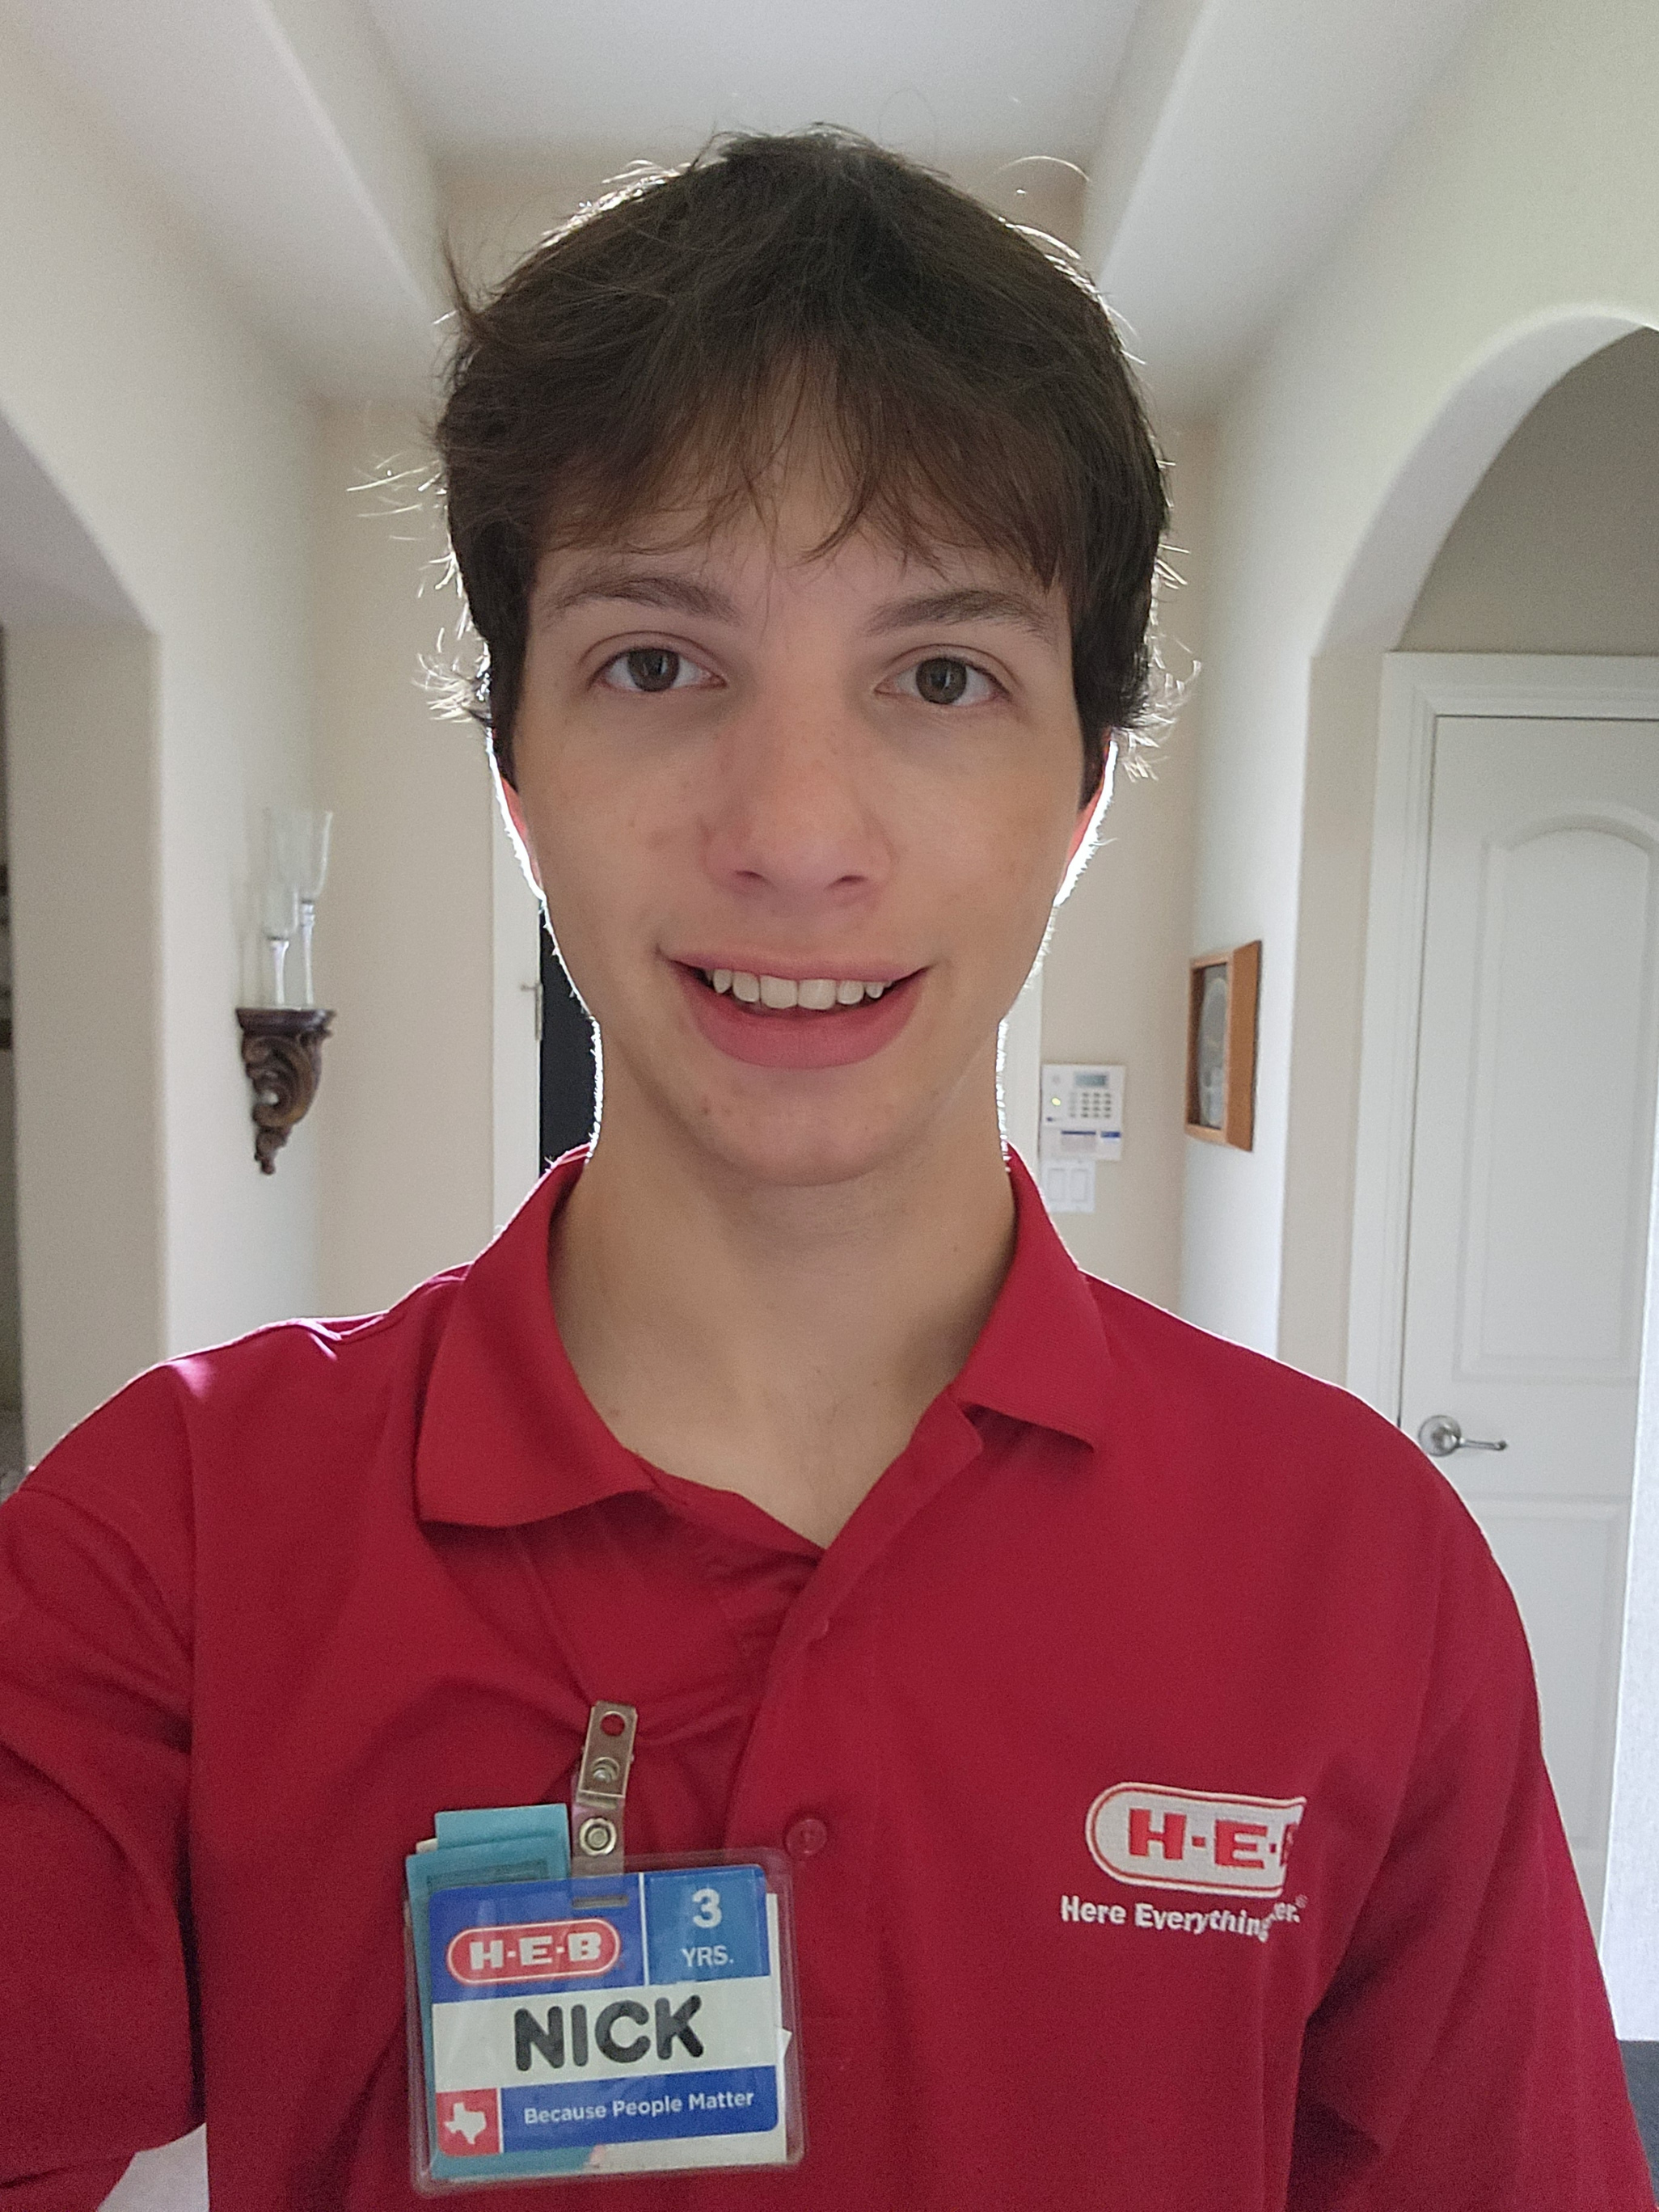
I've worked as a Checker at H-E-B for four years! I work as a cashier, bagger, and cart pusher and have received multiple positive surveys.
I am a fourth year student at UT Austin majoring in Mathematics. I am also earning a minor in Statistics & Data Science, as well as a certificate in Computer Programming. 🤘


.png)

